 Fraunhofer Institute for High Frequency Physics and Radar Techniques FHR
Automated and smart data analysis is needed in many areas. Typically, this is done using artificial intelligence (AI), which in turn often relies on neural networks. However, what exactly these networks do when making their decisions is in most cases unknown. Fraunhofer FHR is now investigating the processes that have so far remained hidden and have often been difficult for users to understand.
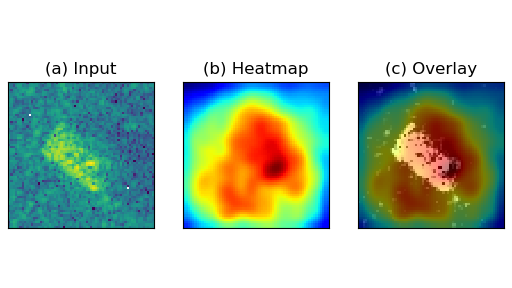
Artificial intelligence and neural networks are trending topics that permeate a wide range of domains – from mobility and production processes through to defence. As the volumes of collected data continue to grow, there is an increasing need for support in analysing them. Neural networks usually deliver good results, but: in general, it is not clear how they arrive at these results – they resemble a black box. In some cases, they rely on irrelevant information in the image: in a project described in the scientific literature on ship classification, for example, the neural networks did not analyse the ships themselves, but almost exclusively the water in the image.
For customers who depend on reliable AI applications, this raises a central question: are the neural networks actually doing what they are supposed to do? In other words, can their results be trusted?
Explainable AI for transparent decision-making
Researchers at Fraunhofer FHR are addressing these questions under the heading “Explainable AI (XAI)”. Their work is based on publicly available radar data collected during two flyovers of a field. Ten targets had previously been placed on the field – tanks, trucks, armoured vehicles and a bulldozer. The radar data generated during the first flyover were used as training data. The test data were collected during the second flyover, but from a different viewing angle. The targets themselves were not moved; they remained in the same position. This setup makes it possible to investigate whether the neural networks truly recognise the actual objects, or whether they inadvertently use background features such as trees or ground textures for classification.
Insights into network analysis: feature maps and heatmaps
For an initial analysis, both feature maps and heatmaps were used. In the feature maps, the algorithms evaluate the intermediate results of the individual layers in which the neural networks process the data. Salient properties such as edges or the length of the target become apparent. In deep neural networks, however, this type of analysis quickly becomes confusing, as the complexity of the feature maps increases with network depth.
Therefore, in a second step, all relevant features that the neural networks “focus on” were aggregated into a heatmap. To generate these heatmaps, the Score-CAM method was employed; it highlights which regions of the image actually contribute to the final decision.
The results speak in favour of the neural networks developed at Fraunhofer FHR: they analyse the intended targets rather than the background. For users, this is a key indication of the robustness and reliability of the models.
Additional in-depth analysis: SHAP explains the influence of individual pixels
Finally, an analysis of the contribution of individual pixels was carried out using SHAP. SHAP is based on a game-theoretic analysis of individual features and their influence on the overall output of the neural network. This method reveals which parts of a target strongly support the correct class, but also which parts might lead to confusion with other classes.
The result is visualised for two images of a tank in the second figure. For this analysis, the database was divided into four classes: tanks, trucks, armoured vehicles and bulldozers. The input image is shown on the far left; the remaining images display the SHAP values. The higher the intensity, the more strongly the corresponding features influence the respective class: red increases, blue decreases the confidence in the class decision.
Striking is the strong red colouring for the class “tank” and the blue colouring for the class “armoured vehicles” – an indication of similar features that can lead to misclassifications. In the upper example in the figure, it is particularly interesting that certain features which also appear in the “bulldozers” class actually increase the confidence in assigning the image to the “tank” class – a combination that may occur only in this context. This illustrates how important further research into explainability is in order to be able to interpret and justify network decisions even more precisely.